
What an AI Report Generator Actually Does — and How to Choose the Right One
From raw data to finished file: the methodology behind AI report generation, and why the pipeline matters more than the model.
What an AI Report Generator Actually Does — and How to Choose the Right One
An AI report generator is software that uses artificial intelligence to produce a structured, formatted report from raw inputs — data files, database queries, search results, or a combination of all three. The best implementations run a full five-stage pipeline: gather data, analyze it, build visualizations, compile everything into a document, and export a finished file. A plain large language model (LLM) can only handle stage two reliably; a true agent handles the whole pipeline autonomously.
Understanding that distinction saves you from picking the wrong tool, writing the wrong prompts, and spending hours finishing by hand what the software was supposed to finish for you.
The Five-Stage Report Generation Pipeline
Every competent AI report generator — whether it is a purpose-built SaaS tool or an AI agent — must accomplish five distinct tasks in sequence. Knowing these stages lets you evaluate any product honestly and spot gaps before they become problems.
 Every complete AI report runs through these five stages. A gap at any stage forces manual work.
Stage 1 — Gather Data
Before any AI can write a word, it needs data. This stage covers pulling information from wherever it lives: CSV or Excel uploads, database connections, REST APIs, web search results, or PDF documents you supply. The sophistication of this stage determines how much manual work you do upfront.
A basic text-only tool requires you to copy-paste data into the prompt yourself. An agent with real tools can run a SQL query, call an API endpoint, or search the web and pull live figures autonomously — no human data-wrangling required.
Checklist for this stage:
- What data sources does the tool connect to natively?
- Can it refresh on a schedule, or does every run start from scratch?
- Does it handle multi-source joins (e.g., CRM data + web analytics)?
Stage 2 — Analyze
Analysis is where the LLM does its core work: spotting trends, flagging anomalies, computing summary statistics (sometimes via code execution), and generating the narrative text that interprets the numbers. This is the one stage every AI writing tool can claim to support.
The quality gap here is not between models — GPT-4 class models all write serviceable analytical prose. The gap is between tools that can execute code (Python, R, SQL) to derive actual figures versus tools that hallucinate plausible-sounding statistics from memory. Always distinguish "the AI wrote about the data" from "the AI computed from the data."
Stage 3 — Visualize
Charts and graphs are not optional accessories; for most business reports they carry more information per square inch than any paragraph. This stage requires code execution: a program must run matplotlib, Plotly, or an equivalent library to produce an actual image file.
A pure text generator cannot do this. An agent running in a sandbox can write and execute a Python script, produce a chart as a PNG, and then embed that image in the document — all without human intervention. This is one of the clearest practical differences between a chatbot and a full-pipeline agent.
Stage 4 — Compile and Format
Raw outputs — text blocks, chart images, tables — need to be assembled into a coherent document structure: title page, executive summary, sections with headings, numbered tables, footnotes, citations, page numbers. This stage is typically handled by programmatic document generation (PDF rendering libraries, DOCX templating) rather than the LLM itself.
Good tools apply a consistent template. Great tools let you customize that template. Weak tools dump a wall of markdown and leave the formatting to you.
Stage 5 — Export
The final deliverable needs to exist as a file or shareable artifact: a PDF you can send to a board, a DOCX you can edit in Word, a PPTX for a presentation, or a link your team can open in a browser. If the tool only shows text on-screen and expects you to copy-paste it into another application, the pipeline is incomplete.
Two Approaches: Point Tools vs. Agent Pipelines
With the five stages mapped out, the market splits into two clearly different approaches.
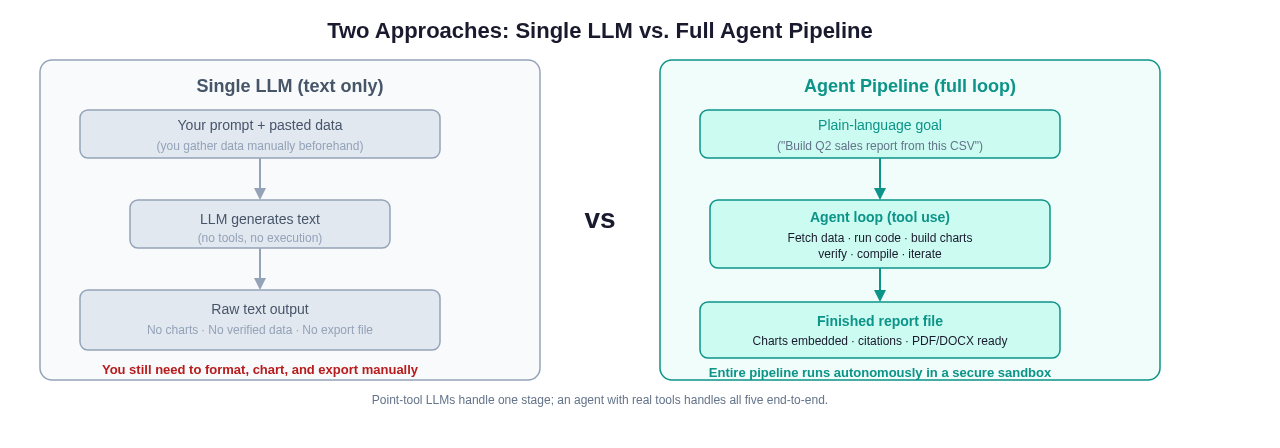 A single LLM covers one stage. An agent with real tools covers all five and hands you a finished file.
Approach 1 — Single-Purpose LLM Tools
These tools — countless SaaS products with "AI report generator" in their marketing copy — wrap a language model and handle one or two stages well. They tend to excel at Stage 2 (analytical prose, summaries, executive writing) and sometimes Stage 4 (applying a prebuilt template). They rely on you to do Stage 1 (gather and paste data), and they often skip Stages 3 and 5 entirely.
Use cases where this is fine: you already have the data cleaned and ready; you need polished narrative prose around it; the output format is simple text or a basic PDF.
Use cases where this falls short: your data lives in a database or API that changes; the report needs real charts built from live figures; you want a finished document file, not markdown you still have to format.
Approach 2 — Agent Pipelines
An AI agent operates in a loop: it receives a goal, chooses a tool to call, observes the result, chooses the next tool, and continues until the goal is met. Applied to report generation, an agent can call a web-search tool to pull market data, run a Python script to compute year-over-year growth, call a charting library to render a bar graph, and invoke a document builder to stitch everything into a PDF — all in a single session.
The key enabling ingredient is the sandbox: a secure execution environment where the agent can run arbitrary code without affecting anything outside it. Without a sandbox, agents cannot run code; without code execution, they cannot produce real charts or real computed figures.
For teams running this kind of pipeline at scale, the engineering choices behind the agent loop matter — the harness engineering guide covers how the orchestration layer and tool registry are structured in production.
How to Prompt an AI Report Generator Well
Prompt quality determines output quality, regardless of which approach you use. These patterns work across most tools.
The Report Brief Pattern
Do not ask the AI to "write a report about Q2 sales." Instead, supply a structured brief:
Goal: Quarterly sales performance report for the executive team
Data: [attached: q2_sales.csv]
Audience: CFO and VP of Sales — assume financial literacy, skip basic definitions
Sections required: Executive Summary (150 words max), Regional Breakdown, Product Mix Analysis, Forecast vs Actual, Recommendations
Chart requests: bar chart of revenue by region, line chart of weekly trend vs prior year
Tone: Direct, data-first. Lead each section with the key finding, not the methodology.
Format: PDF, 8–12 pages, company template
This brief is machine-parseable. Every line maps to an agent action or a document parameter. Vague prompts produce vague reports.
Grounding Instructions
For accuracy, explicitly tell the tool what its authority boundary is:
- "Use only the data in the attached file. Do not use any figures from your training data."
- "If a figure is unavailable in the source data, write '[DATA REQUIRED]' rather than estimating."
- "Cite every statistic with a row reference or source URL in a footnote."
These instructions do not guarantee accuracy, but they make violations visible — which is far better than confident hallucinations embedded in a chart caption.
Iteration Prompts
Good report generation is rarely one-shot. Useful follow-up prompts:
- "The executive summary is too long. Condense to three bullet points."
- "Expand the recommendations section with specific action items and owners."
- "The chart on page 4 uses absolute numbers. Redo it as percentage change."
- "Add a data sources appendix listing every file used."
Treat the first output as a draft and iterate. The agent remembers the context of your session; use that.
Accuracy and Hallucination Caveats
This section exists because most AI report generator marketing glosses over it, and you should not.
LLMs do not know your data — they infer patterns. If you ask a model to "summarize Q2 revenue" and your uploaded file has a formatting issue that caused column B to be misread, the model will produce confident prose about wrong numbers. The model has no way to know the file had a problem.
Computed statistics require verified code execution. If the tool you use does not run code against your data — if it merely reads the data and writes prose — every number in its output is a probabilistic guess, not a computation. This is a binary distinction: either the agent ran sum(revenue_col) or it did not. Ask vendors directly.
Citation chains break. An agent that searches the web and then writes "According to [source], revenue grew 23%" may be accurately quoting a real page — or it may be confabulating a plausible source. Always spot-check external references, especially for reports that will inform decisions.
Mitigation strategies:
- Use grounding instructions (above) to push the model to cite sources inline
- Run a verification pass: after the report is generated, ask "List every statistic in this report and its source. Flag any you cannot verify."
- For financial or legal reports, treat AI output as a structured draft, not a final document; a human must review the numbers
For a deeper look at how these caveats apply in financial contexts specifically, see the guide on using AI for financial reporting.
Worked Example: Monthly Sales Report in Practice
The following walkthrough shows what a full-pipeline agent session looks like, stage by stage, using a fictional company's data.
The goal: "Create a monthly sales performance report for March, using the attached CRM export. Include regional breakdown, top 10 products by revenue, comparison to February, and an executive summary. Export as PDF."
Stage 1 — Gather: The agent reads the uploaded CSV (8,400 rows, 14 columns: date, rep, region, product SKU, units, revenue, cost). It also calls a web-search tool to pull the current month's exchange rate, since 18% of revenue is in euros.
Stage 2 — Analyze: A Python script computes: total March revenue ($4.2M), month-over-month change (+7.3%), revenue by region (Northeast: 34%, West: 28%, South: 22%, Central: 16%), top 10 SKUs ranked by revenue, and gross margin by product line. The LLM writes interpretive prose: "Northeast continued to outperform, driven primarily by enterprise SKU growth. The West region saw a 12% contraction, concentrated in the SMB segment."
Stage 3 — Visualize: The agent calls a charting library to produce: (a) a bar chart of revenue by region, (b) a line chart of weekly revenue in March vs February, (c) a horizontal bar chart of the top 10 SKUs. All three are rendered as PNG files saved to the sandbox filesystem.
Stage 4 — Compile: A document builder pulls in the three chart images, merges them with the analytical prose sections, applies the company header/footer template, and numbers the pages. The executive summary (148 words, bullet-led) is placed first. A data sources appendix lists the CRM export filename and the exchange rate source URL.
Stage 5 — Export: The agent renders a 14-page PDF and makes it available for download. The total elapsed time: approximately 90 seconds.
The same workflow, done manually, involves exporting the CRM, opening Excel, writing pivot tables, copying figures into PowerPoint, building charts, writing the prose in Word, and assembling everything — typically two to four hours of skilled analyst time.
For teams running this kind of workflow regularly across multiple data sources, the full automation patterns are covered in the guide to automating data analysis for analysts.
Choosing the Right Tool: A Decision Framework
Before selecting an AI report generator, answer these four questions:
1. Where does your data live? If it lives in files you can upload, most tools work. If it lives in databases, APIs, or refreshes on a schedule, you need an agent with real connector tools.
2. Do you need charts built from your data? If yes, the tool must support code execution. Verify this with a direct test: upload a CSV with three columns and ask for a bar chart. Does the tool produce an actual image, or does it describe what a chart would look like?
3. What is the output format? If you need a shareable file (PDF, DOCX, PPTX) rather than text on a screen, confirm the tool exports to that format natively.
4. How often does this run? One-off reports can tolerate manual setup. Weekly or daily reports need automation, scheduling, and reliable data connections — which pushes you firmly toward an agent platform.
Frequently Asked Questions
What is the difference between an AI report generator and a BI tool like Tableau or Power BI? BI tools are interactive dashboards that let humans explore data visually. An AI report generator produces a finished narrative document — prose, charts, and all — from a prompt or a scheduled trigger. The two are complementary: some teams use BI tools for exploration and an AI generator to produce the written report that goes to stakeholders.
Can an AI report generator connect to my database directly? It depends on the tool. Simple LLM-based tools cannot; they require data to be pasted or uploaded. Agent platforms with database connector tools can run SQL queries directly against a connected database. Always confirm what connectors a platform supports before committing.
How accurate are AI-generated reports? Accuracy depends on whether the tool computes from your actual data or generates text from pattern-matching. Tools that execute code against your data (Python, SQL) are accurate for quantitative figures — the same way a spreadsheet formula is accurate. Tools that only read and write prose should be treated as drafts requiring numeric verification.
What report formats can AI generators produce? Common outputs include PDF, DOCX, PPTX, HTML, and Markdown. The best agent platforms can produce any format that a code library can generate — which in practice means anything.
Is my data safe when I upload it to an AI report generator? This depends entirely on the platform's data handling policies and infrastructure. Look for: (a) data processed in an isolated sandbox that does not persist after the session, (b) no use of your data for model training, (c) clear data residency information. Avoid uploading confidential financial or personal data to any tool whose privacy policy you have not read.
Can AI report generators replace human analysts? No — and framing the question this way leads to poor decisions. They eliminate the mechanical parts of analysis: data extraction, formula writing, chart building, document assembly. They do not replace the judgment parts: knowing which question to ask, spotting a business anomaly that is not visible in the numbers, deciding what to recommend. The best use of an AI report generator is to give analysts more time for the judgment parts.
How do I handle reports that require data from multiple sources? An agent that can use multiple tools in the same session handles this naturally — it calls each source in sequence and merges results before writing. Single-LLM tools require you to pre-merge the data yourself and upload a single file.
What is a "sandbox" and why does it matter for report generation? A sandbox is an isolated compute environment where code runs without access to the broader system or internet except through approved connectors. For report generation, it matters because: (a) the agent can run arbitrary code (Python, shell scripts) safely, (b) your data does not leak to other users' sessions, and (c) if the generated code has a bug, it cannot harm anything outside the sandbox.
Can I use my own template or brand guidelines? Better agent platforms let you supply a template file (DOCX, PPTX, or CSS/HTML) that the agent applies to the compiled output. This is a significant workflow feature for teams with strict brand standards.
Where Happycapy Fits
Happycapy is an agent platform, not a text generator. It runs an agent loop inside a secure cloud sandbox equipped with real tools: web search, file I/O, code execution (Python, shell), chart generation, and document export. When you give it a report goal, it runs the full five-stage pipeline and hands you a finished file — the same workflow described in the worked example above.
The distinction matters because it means you give Happycapy a goal ("build me a Q2 report from this data") rather than a prompt ("write text about Q2"), and you get back a PDF or DOCX rather than text you still have to format. It supports 150+ models, so you can choose the LLM that best fits the analytical task at hand, and the sandbox means your data stays isolated for the duration of the session.
If you run reports regularly — sales, financial, competitive, operational — and find yourself spending hours on the mechanical steps, that is the gap Happycapy is built to close.