AI Agent for Data Analysis: Real Numbers, Not Guesses
Upload your data; the agent writes the code, runs it in a sandbox, and hands back charts and a written report — no Python required.
What an AI Agent for Data Analysis Actually Does — and Why It Beats "Asking ChatGPT About Your Data"
An AI agent for data analysis is software that accepts raw data — a CSV, an Excel workbook, a database connection — writes analysis code, executes that code in an isolated environment, and hands back finished charts, verified numbers, and a written narrative. It does not describe what you could do with your data; it does it. That distinction separates a data-analysis agent from every AI chatbot and most traditional business-intelligence tools, and it is the reason the category is growing fast.
This page explains what a data-analysis agent is, how it differs from the two tools you probably already use (a chatbot and a BI dashboard), the step-by-step workflow it follows, a worked example you can replicate today, the caveats you need to know about accuracy and verification, what to look for when choosing one, and how to get started.
AI Agent vs. Chatbot vs. BI Dashboard: The Core Differences
Understanding where a data-analysis agent sits in the landscape requires comparing it honestly to two alternatives many people already use.
"Ask ChatGPT about your data" — what actually happens
When you paste a data sample into a general-purpose chatbot and ask "what are the trends here?", the model reads the text you pasted and generates plausible-sounding prose. It may quote numbers. Those numbers are not calculated from your data; they are predicted as likely continuations of your prompt. If your CSV has 50,000 rows, you pasted perhaps 20 of them — the model cannot see the rest. There is no code being run. There is no chart being drawn. The model is pattern-matching against training data about what analysis of that type tends to look like.
This is useful for orientation. It is not useful for decisions that depend on correctness.
Traditional BI dashboards — what they can and cannot do
Tools like Tableau, Looker, and Power BI can query live data and produce genuine charts from genuine computations. They are excellent for monitoring recurring metrics on stable schemas. Their limitation is rigidity: you need a data engineer or BI developer to build each view. An ad-hoc question like "which product categories drove the spike in returns last Q3, broken down by region and day-of-week, excluding the three largest customers?" requires a ticket, not a conversation. BI dashboards answer predefined questions beautifully; they answer new questions slowly.
The AI data-analysis agent
An AI data-analysis agent closes both gaps. It accepts arbitrary data, understands natural-language questions, and produces verified output by writing and running real code in a sandboxed environment. The numbers in the output are computed, not hallucinated. The chart is a real image file, not a description of one. Because it can iterate — fix errors in its own code, reframe the question, pull in additional libraries — it handles the messy, one-off analytical request that neither a chatbot nor a pre-built dashboard can serve.
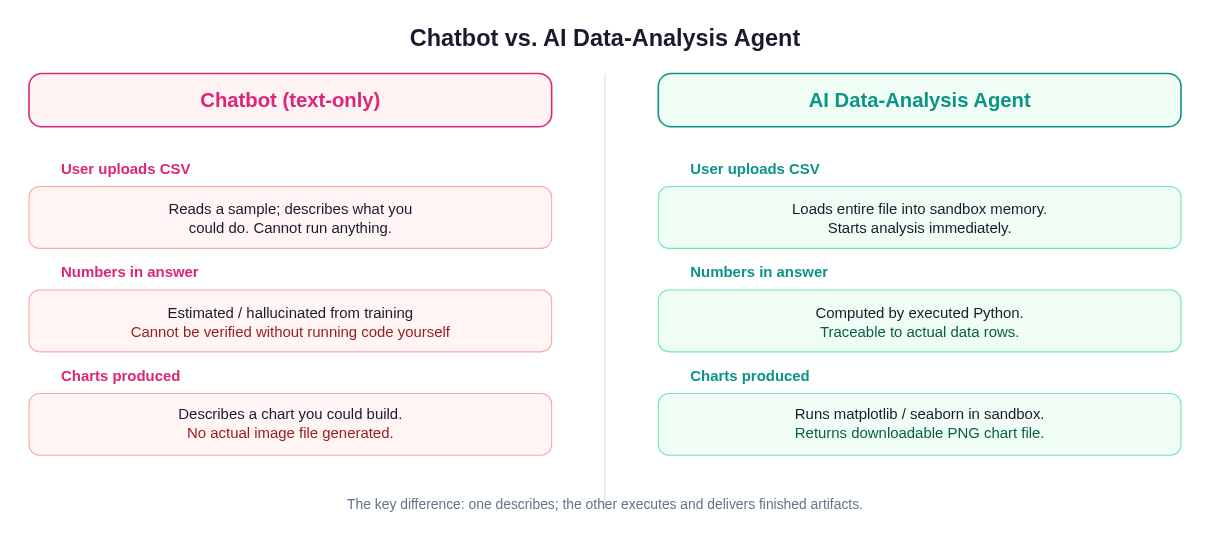 A chatbot describes what analysis would look like. An AI data-analysis agent runs the code and delivers the finished artifact.
The Five-Stage Pipeline
Every capable data-analysis agent follows a recognizable pipeline. Understanding it helps you evaluate tools and set the right expectations.
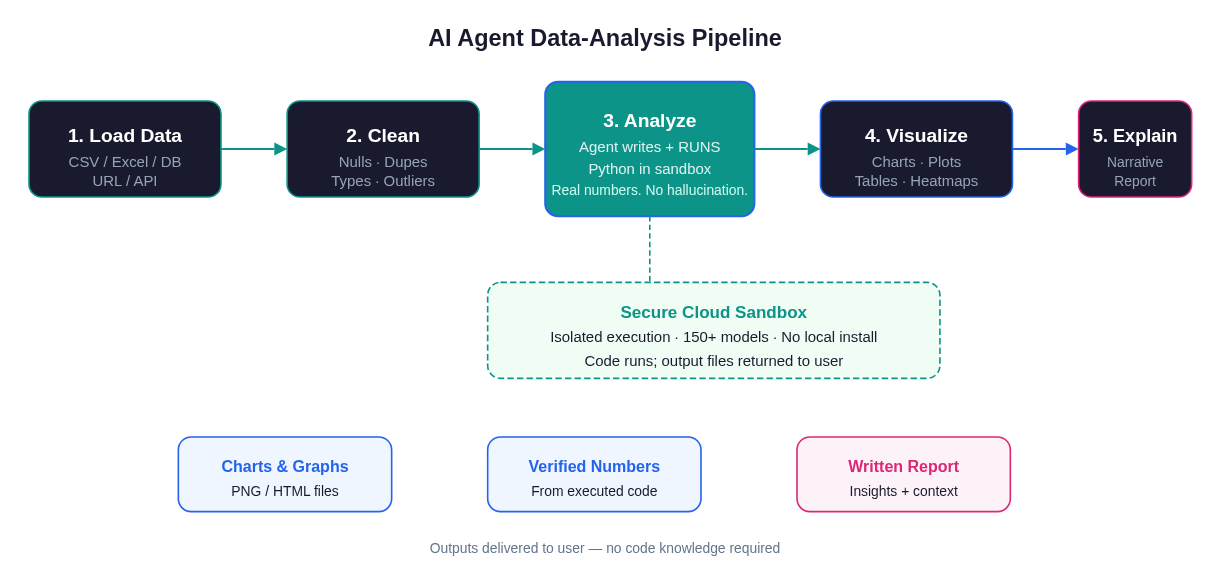 The full pipeline from raw data upload to finished narrative report, including the sandboxed code-execution step that makes output verifiable.
Stage 1: Load
The agent ingests your data source. That might be a CSV you drag in, an Excel file with multiple sheets, a connection string to a PostgreSQL or MySQL database, a public URL, or an API endpoint. A good agent handles encoding issues (UTF-8 vs. Latin-1), mixed data types in columns, header detection, and multi-sheet workbooks without requiring you to clean anything first. Libraries like pandas and DuckDB are workhorses here — they handle gigabytes of data efficiently inside a sandbox process.
Stage 2: Clean
Before any analysis runs, the agent profiles the data: how many rows, what columns, what types, how many nulls, are there obvious duplicates, are date columns parsed correctly? It then writes and executes cleaning code. Nulls get imputed or dropped based on the column's role. Duplicate rows are flagged. String columns that should be numeric are coerced. This stage often surfaces the most important problems in a dataset — a date column that was stored as text, a currency column with commas, a product ID column with trailing spaces — and a good agent will report what it changed before proceeding.
Stage 3: Analyze (the differentiating stage)
This is where the agent earns its category label. It does not tell you how to calculate the correlation between two variables; it writes the code and runs it. The results come back from actual computation on your actual data. If the code raises an error — a division-by-zero, a missing column name — the agent reads the traceback and tries again. This agentic loop, where the model observes the output of its own code and adjusts, is what makes the analysis both robust and auditable. You can ask to see the code; everything is traceable.
Stage 4: Visualize
Charts are generated by running visualization code — typically matplotlib or seaborn — inside the same sandbox process. The output is a real PNG file (or HTML for interactive charts) attached to the session. Because the chart is produced from the same code that produced the numbers, the two are always consistent. There is no hand-editing of chart labels to match rounded numbers; the chart is the data.
Stage 5: Explain
Finally, the agent writes a narrative. It interprets the findings in plain language: which trend is the largest, where the anomaly sits, what the correlation coefficient means in business terms, what caveats apply. This is the stage where the language model genuinely shines — translating computed output into prose a non-technical stakeholder can act on. The explanation should cite specific numbers from the computation, not introduce new estimates.
Worked Example: Analyzing a Sales CSV
Here is a concrete walkthrough using a realistic dataset. Say you have a sales_2024.csv with columns: date, region, product_category, revenue, units_sold, returns.
Step 1 — Upload the file. In Happycapy, you drag the CSV into the chat. The agent reads it: 14,832 rows, 6 columns, date range January–December 2024, no nulls in revenue but 3.2% missing values in returns.
Step 2 — Ask a plain-English question. "Which three product categories had the highest return rates in Q4, and how does that compare to Q1?"
Step 3 — Agent writes the code. The agent generates a pandas script that parses the date column, filters to Q1 and Q4, computes return_rate = returns / units_sold per category, and ranks the results.
Step 4 — Code executes. Inside the sandbox, the script runs. It returns a DataFrame:
Category         Q1 Return Rate   Q4 Return Rate
Electronics      4.1%             9.8%
Accessories      2.3%             3.1%
Apparel          3.7%             5.2%
Step 5 — Visualization. The agent generates a grouped bar chart comparing Q1 vs. Q4 return rates by category, exports it as return_rates_q1_vs_q4.png, and attaches the file.
Step 6 — Narrative. The agent writes: "Electronics return rates spiked from 4.1% in Q1 to 9.8% in Q4 — more than doubling. Given that Q4 encompasses the holiday season, this may reflect gift purchases that didn't match recipient expectations. Apparel also rose, though more moderately. Accessories remained relatively stable. Recommend reviewing Electronics returns data for the specific SKUs driving the spike."
The entire exchange takes under two minutes. No Python knowledge required. The numbers in the narrative are the numbers in the table; they came from the same code execution.
Why Code Execution Beats Text-Only Analysis
The case for code execution is not just philosophical. It has practical consequences.
Correctness is auditable. When an agent produces a number, you can ask "show me the code that produced this." The answer is a deterministic script you can re-run. When a chatbot produces a number, the answer is "my language model predicted this token as likely given your prompt." These are not equivalent.
Scale is real. A language model's context window is measured in tokens, roughly tens of thousands of words. A CSV with 500,000 rows cannot be pasted into a prompt. Code executes on the full dataset regardless of size. A well-implemented agent uses the language model to write the code and the compute environment to run it — combining the strengths of both.
Iteration is automatic. Analysis rarely goes right on the first attempt. A groupby that fails because a column has unexpected nulls, a date parse that chokes on mixed formats, a merge that produces a Cartesian product because the key columns had trailing whitespace — these are routine. A code-executing agent catches the error, reads the traceback, and fixes the code. A text-only agent tells you the error exists and asks you to fix it.
Reproducibility is built-in. Because analysis is captured as code, every step is reproducible. You can rerun the same analysis next month on fresh data. You can share the script. You can modify one assumption and see what changes. This makes the agent's output far more durable than a prose answer.
For a deeper dive into how the automation layer works, see How to Automate Data Analysis for Analysts — a companion guide focused specifically on analyst workflows.
What to Look for in an AI Data-Analysis Agent
Not all tools marketed as "AI data analysis" actually execute code. Here is how to evaluate them.
Code execution in an isolated sandbox
The most important criterion. Does the tool run Python (or R, or SQL) against your actual data in an isolated process? Ask for the code; if the tool cannot show you runnable code that produced its output, it is a text-only tool. The cloud sandbox architecture matters here — execution needs to be isolated so that one user's data cannot leak to another and so that malicious or buggy code cannot harm the underlying infrastructure.
Iterative error recovery
Run a test with a slightly malformed file — a CSV with mixed date formats, a column name with a space, a numeric column that contains one text value. Does the agent detect and fix the problem autonomously, or does it fail and ask you to pre-clean the data? Robustness under messy real-world data is what separates production-ready agents from demos.
Transparency of reasoning
You should be able to see what the agent did at each step: what code it wrote, what the output of that code was, what decisions it made about cleaning. An agent that returns only a polished report without any visibility into the underlying steps is difficult to trust for high-stakes decisions.
Model flexibility
Analysis tasks have different requirements. Exploratory analysis on a small file needs a fast, cheap model. Statistical modeling on a large dataset benefits from a highly capable model. A platform that offers access to multiple models — and lets you choose or route automatically — lets you optimize for both cost and quality. Happycapy's access to 150+ models supports this natively.
Output completeness
The agent should return all artifacts: cleaned data if requested, code files, chart images, and a written report. Some tools return only one of these. You want the full package so downstream stakeholders can verify, present, and reproduce the work.
For a detailed look at how the underlying harness engineering makes multi-step agent execution reliable, see Harness Engineering for AI Agents.
Limitations and Accuracy Caveats
Responsible use requires understanding what a data-analysis agent does not do well.
It cannot know your business context. The agent does not know that "returns" in your data means warranty claims, not retail returns, unless you tell it. Domain framing is your job. The more context you provide — what the columns represent, what a "good" number looks like in your industry, what anomalies you have already investigated — the better the analysis.
Statistical correctness requires review for high-stakes decisions. The agent will choose sensible defaults — means over medians, Pearson over Spearman — but "sensible defaults" are not always the right choice for your data distribution. If you are presenting results to a board or using them to allocate significant budget, have a statistician review the methodology even if you trust the execution.
It is as good as your data. Garbage in, garbage out applies absolutely. An agent will faithfully compute the wrong answer from incorrect source data. Data quality is a prerequisite, not a thing the agent handles for you (though it can help surface data quality issues during the cleaning stage).
Long-running computations have practical limits. Training a machine learning model on a large dataset is different from analyzing it. Most data-analysis agents are optimized for exploration and reporting, not for hours-long training jobs. Know the difference.
For use cases that blend analysis with automated report generation, see AI Report Generator — which covers how agents can take analysis output and produce formatted deliverables automatically. If you are building more complex pipelines, AI Research Agent covers agents that combine data analysis with web research.
How to Run Your First AI Data-Analysis Agent Session
Getting started is straightforward with a tool like Happycapy.
-
Prepare your data. Export whatever you want analyzed to CSV or Excel. Fifteen minutes spent making sure columns have clear names will save you several back-and-forth turns with the agent.
-
Open Happycapy and start a session. No local Python install required. The execution environment is entirely in the cloud.
-
Upload the file and describe your goal. Be specific: "I want to understand which regions are underperforming in Q2 revenue relative to their Q1 baseline, and I want a bar chart comparing them." The more specific the question, the more focused the analysis.
-
Review the code the agent writes. Even if you are not a developer, glancing at the code provides a sanity check on whether the agent understood your question.
-
Ask follow-up questions. Analysis is iterative. "Now break that down by product category" or "filter out accounts with under $10,000 in revenue first" are natural follow-ups that the agent handles without starting over.
-
Download the outputs. Charts, cleaned data, and the written narrative are all available as files. The code is available too, so the entire analysis is reproducible.
Frequently Asked Questions
What kinds of data files can an AI data-analysis agent handle?
Most agents handle CSV, Excel (XLS/XLSX), JSON, and Parquet natively. Better platforms also support direct database connections (PostgreSQL, MySQL, SQLite) and API endpoints. Happycapy accepts all of these plus URLs pointing to public datasets.
Is my data safe when I upload it to a cloud agent?
This depends entirely on the platform. Look for sandboxed execution (each session runs in an isolated environment), data-in-transit encryption, and a clear data retention policy. Happycapy executes each session in an isolated cloud sandbox — your data is not accessible to other sessions and is not used for model training. See What Is a Cloud Sandbox for a fuller explanation of the isolation model.
Do I need to know Python or statistics to use one?
No. You interact in plain English. The agent writes and runs the code. That said, some statistical literacy helps you ask better questions and catch results that don't make sense. "What is the median, not the mean, revenue per customer?" is a better question than "what is the average?", and knowing to ask it matters more than being able to code it.
How is this different from asking an AI to write me a Python script?
When an AI writes you a script, you get code. You then need to run it, debug it, fix dependency issues, and interpret the output yourself. A data-analysis agent closes that loop: it writes the code, runs it in a managed environment, handles errors autonomously, and presents finished output. The difference is roughly analogous to asking for a recipe versus having a meal prepared.
Can the agent handle large datasets — millions of rows?
It depends on the platform's sandbox compute resources. Columnar file formats like Parquet and tools like DuckDB can process hundreds of millions of rows on moderate hardware without loading everything into memory. Happycapy's sandboxes are provisioned for real analytical workloads, not just toy datasets. For extremely large data, partitioned queries or database connections are more practical than file uploads.
What if the agent makes a mistake in its analysis?
Because the analysis is expressed as code, mistakes are auditable and correctable. Ask the agent to show you the code. Review the logic. If you spot an error — wrong date filter, groupby on the wrong key — describe the correction in plain language and the agent will rewrite and rerun. This feedback loop is faster than debugging a script yourself and far more reliable than asking a chatbot to reconsider its prose.
Is an AI data-analysis agent a replacement for a data analyst?
No. It is a force multiplier. Experienced analysts use it to eliminate the mechanical parts of the job — the data wrangling, the routine chart production, the first-pass exploration — so they can spend time on the parts that require genuine domain expertise: framing the right question, contextualizing the finding, and translating an insight into a decision. For teams without a dedicated analyst, it provides analytical capability that would otherwise not exist at all. The companion guide for analysts covers how to integrate it into an analyst's workflow specifically.
How is this different from a BI dashboard like Tableau or Looker?
A BI dashboard is pre-built for known, recurring questions on a stable schema. It answers those questions well, at scale, in real time, for a large team. An AI data-analysis agent is built for new, ad-hoc questions on arbitrary data. They serve different moments: the dashboard for "give me this week's sales numbers on the same view I used last week," the agent for "I just received this dataset from a new vendor and need to understand it by end of day." Most mature data teams will use both.