
Infographic Creator
Design stunning data visualizations and infographics
What Is This?
Overview
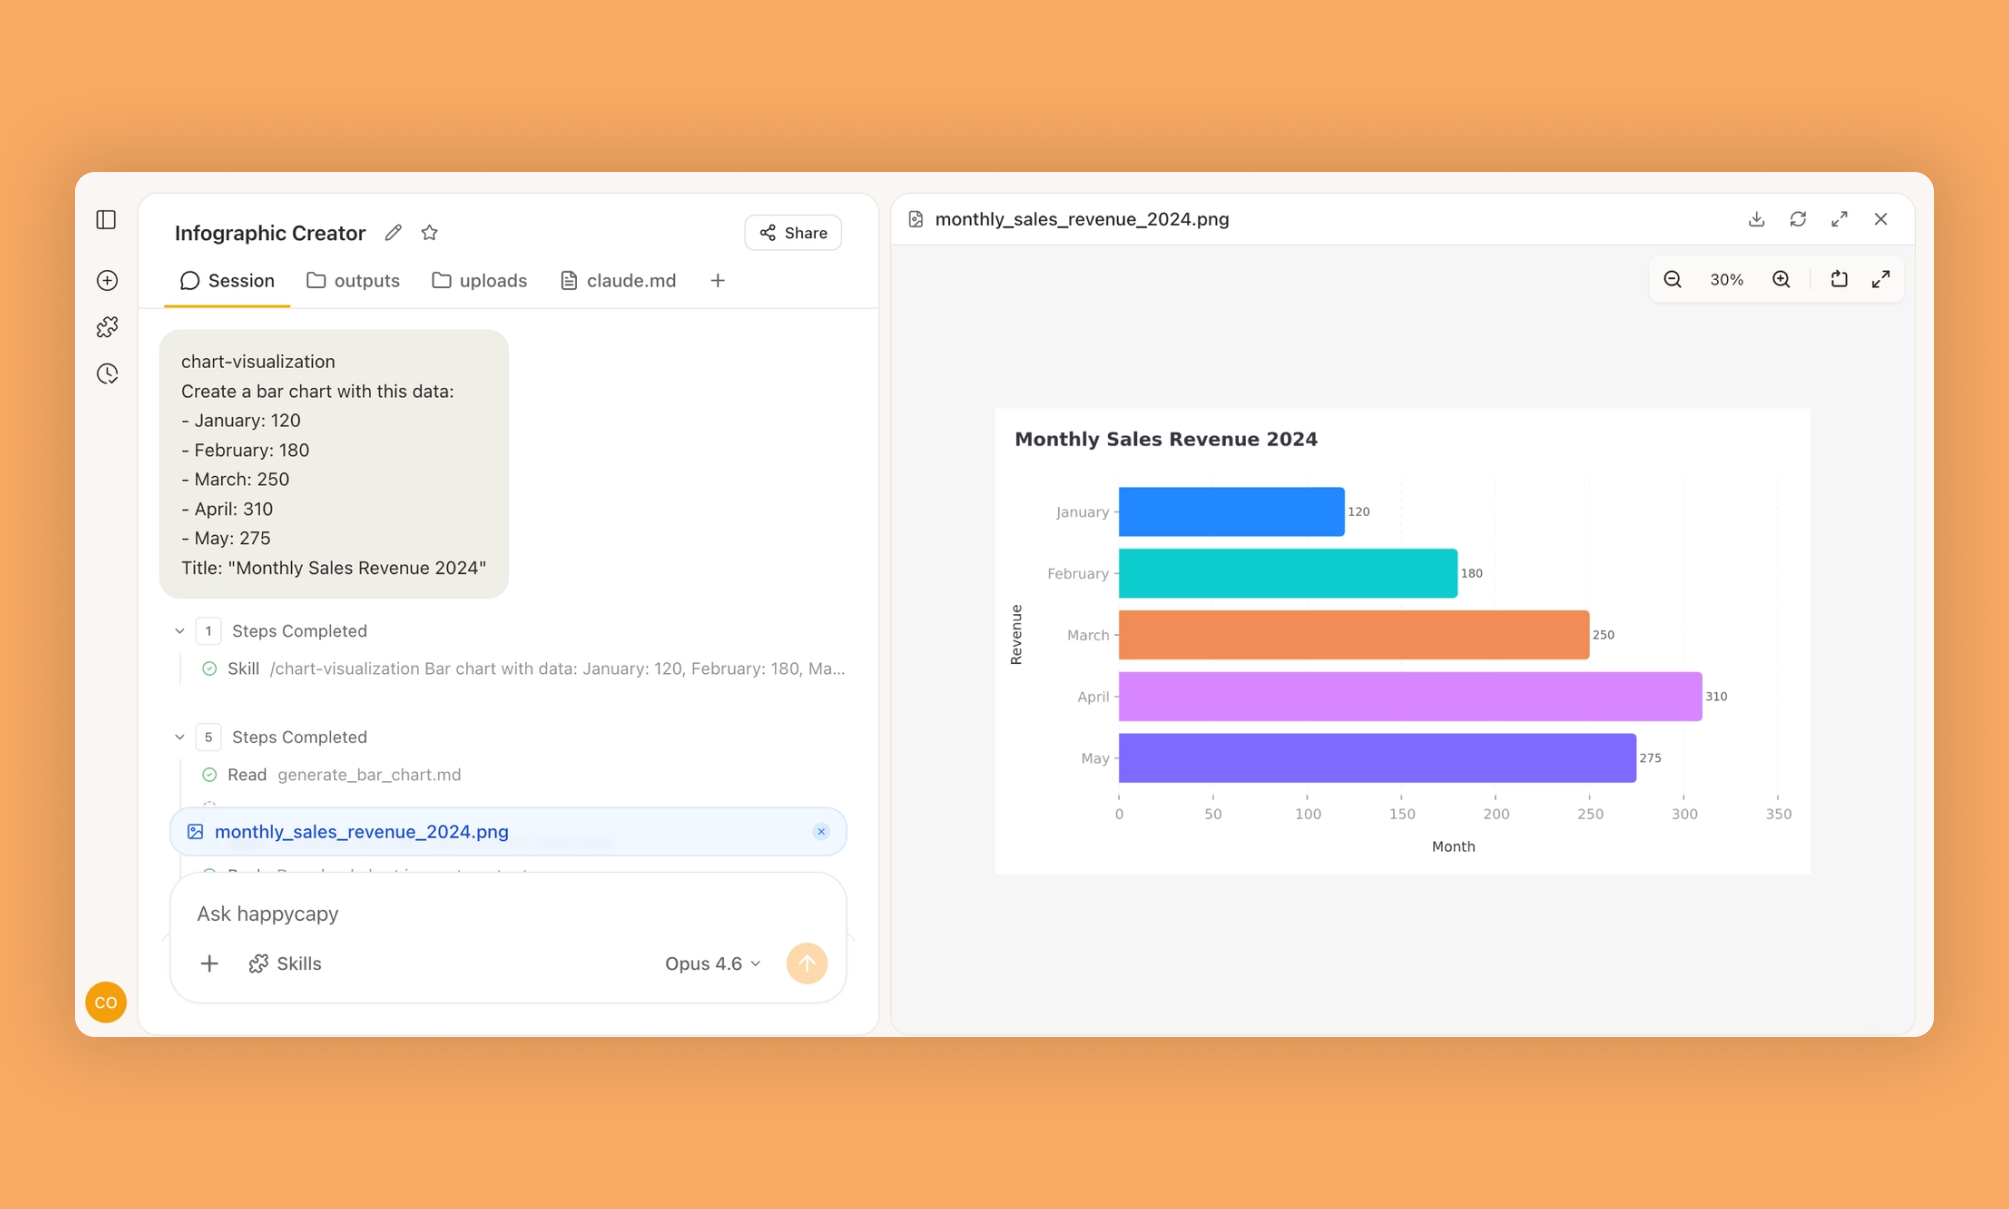
Infographic Creator transforms complex data and information into visually compelling graphics that communicate insights effectively. It takes raw data, statistics, or concept outlines and converts them into visual formats optimized for comprehension and sharing across digital and print channels.
The tool handles the complete infographic design process from data analysis and story arc development to visual layout and element styling. It ensures information flows logically, data is represented accurately, and visual design enhances rather than distracts from the core message.
Who Should Use This
Marketing Teams: Create shareable visual content for social media, blogs, and email campaigns that increases engagement and message retention.
Data Analysts: Transform analytical findings into visual presentations that stakeholders can understand without deep data expertise.
Educators: Develop educational materials that explain complex concepts through visual storytelling.
Content Creators: Produce high quality visual assets for articles, presentations, and reports requiring data visualization.
Corporate Communications: Design internal reports that make company data accessible to all employee levels.
Why Use It?
Problems It Solves
Data Overload: Audiences struggle to process large amounts of numerical data in tables or text. Infographics distill key insights into scannable visual formats that highlight the most important findings.
Low Engagement: Text heavy content fails to capture attention in crowded digital spaces. Visual infographics increase content sharing and improve message retention compared to text only alternatives.
Technical Communication Barriers: Complex topics are difficult to explain to non expert audiences. Well designed infographics bridge knowledge gaps by presenting information in universally understandable visual formats.
Core Highlights
- Data Visualization: Transform statistics into charts, graphs, and visual metaphors that clarify patterns and relationships
- Information Hierarchy: Structure content flow that guides viewers through information in logical sequence
- Visual Storytelling: Create narrative arcs that make data compelling and memorable
- Color Schemes: Apply color theory principles that enhance readability and emphasize key information
- Typography Systems: Use font hierarchies that improve scannability and information processing speed
- Export Options: Generate formats optimized for web, social media, print, and presentation contexts
How to Use It?
Basic Usage
Provide your data set or key statistics along with the main message you want to communicate. The skill generates infographic layouts that present information in visually logical formats.
Create an infographic showing annual renewable energy adoption growth across major economies with focus on solar and wind power trendsSpecific Scenarios
Process Visualization
Design an infographic explaining the customer onboarding journey from signup through first purchase with key metrics at each stageComparison Charts
Generate a comparison infographic highlighting feature differences between three subscription tiers with pricing and value propositionsAdvanced Tips
Design infographic series with consistent visual language for campaign cohesion. Optimize layouts for vertical mobile viewing since most sharing happens on mobile devices. Include brand elements subtly so infographics remain shareable while building recognition. Test color schemes for accessibility ensuring information remains clear for color blind viewers.
When to Use It?
Use Cases
Annual Reports: Transform financial and operational data into visual summaries that make annual reports more accessible and engaging.
Social Media Content: Create shareable visual assets that communicate key messages in formats optimized for platform algorithms and user behavior.
Sales Presentations: Develop visual proof points and data storytelling elements that make pitches more persuasive and memorable.
Educational Materials: Design learning resources that explain concepts through visual metaphors improving comprehension and retention.
Press Materials: Create media ready visual assets that journalists can easily incorporate into stories about your research or announcements.
Important Notes
Requirements
Clean, accurate data organized in structured formats suitable for visualization. Clear understanding of target audience and communication goals to guide design decisions. Brand guidelines or visual preferences to ensure infographic design aligns with organizational identity.
Usage Recommendations
Do:
- Simplify data to highlight key insights rather than overwhelming viewers with every data point
- Test infographic readability at actual display sizes especially for mobile and social media
- Cite data sources clearly building credibility and allowing viewers to explore further
- Optimize file sizes for web performance without sacrificing visual quality
Don't:
- Mislead with manipulated scales or cherry picked data that distorts actual findings
- Overcrowd layouts with excessive text or graphics that reduce clarity and scannability
- Ignore accessibility standards making content unusable for viewers with visual impairments
- Skip proofreading which damages credibility despite high quality visual design
Limitations
Data Accuracy Dependency: Infographic quality depends entirely on source data accuracy and interpretation correctness.
Simplification Tradeoffs: Visual formats require simplifying complex information potentially losing important nuances and context.
Cultural Interpretation: Visual metaphors and color meanings vary across cultures requiring localization for international audiences.
FAQ
Q: Can I use the Infographic Creator Skill to generate custom data visualizations?
Yes, the Infographic Creator Skill allows you to design custom data visualizations using the Happycapy platform. You can input your own data and choose from various chart types.
Q: Does this Skill support exporting infographics in different formats?
The Infographic Creator Skill supports exporting your visualizations in multiple formats, making it easy to share or embed your creations. Happycapy ensures compatibility with common image and document types.
Q: How does the AI agent assist in creating infographics?
The AI agent in this Skill helps automate the design process by suggesting layouts and color schemes based on your data. This streamlines infographic creation within the Happycapy Skills ecosystem.
Q: Is it possible to collaborate with others using the Infographic Creator Skill?
Yes, you can collaborate with team members on Happycapy by sharing your infographic projects. The Skills platform supports real-time updates and feedback.
Q: What kind of data sources can I connect to the Infographic Creator Skill?
You can connect various data sources, including CSV files and online datasets, to the Infographic Creator Skill. The AI agent helps interpret and visualize your data efficiently within the Skills framework.
More Skills You Might Like
Explore similar skills to enhance your workflow
LLM Council
Multi-model LLM council with live dashboard for querying multiple AI models simultaneously and synthesizing consensus
Create Design System Rules
Generate custom design system rules for Figma workflows
Treatment Plans
Generate detailed, professional medical treatment plans for clinical use
Slack Gif Creator
Design and export high-quality animated GIFs specifically optimized for seamless sharing on Slack
Capy Cortex
Autonomous learning system that learns from mistakes and reflects on sessions to get smarter over time
AI Image Generation
Generate AI images with 50+ models via inference.sh